How to find out CPU Utilization in Linux?
June 1, 2010 | Posted byThere are various ways to check the CPU usage on a Linux server, like using top and ps commands OR by installing the sysstat package which includes sar, iostat, mpstat commands to check the daily CPU usage on the Linux server.
CPU is the most important component in any server which is use to process all the tasks on your server. Whenever CPU is engaged in processing a specific task, it becomes unavailable for other processes. The other processes have to wait till the CPU is free thus creating a bottleneck in the system.
Using the following commands, one can track the:
- Real time view of CPU utilization on the system
- Utilization of each CPU on the system
- CPU utilization of each running process
- Average cpu usage since the last reboot
1) Top:
One of the common command in Linux to check the CPU usage is “top”. The top command provides a real time view of everything which includes CPU utilization, Memory utilization, running processes. To execute the command, just type “top”.
# top
The above output shows dynamic values of various CPU parameters like user, system, nice, idle, iowait.
2) PS:
The ‘ps’ command by default display the status of our terminal connection. ps offers various options to display the status of currently running processes. For example,
# ps -auxf
will display all the details of all the processes like User, PID, CPU/memory usage, the terminal it is executed from, the time and the process being executed.
You can use ‘ps’ command to sort out the high CPU utilization processes as well which in turn helps you to optimize your server in a better way. The option “eo” with ps is use to display contents field wise and then we can sort the generated output using ‘sort’.
# ps -eo pcpu,pid,user,args | sort -k 1 -r
- Install SYSSTAT package to install different monitoring tools.
The other 3 commands to find out CPU utilization are
iostat
mpstat
sar
but they are not available by default.
In order to use the above commands, you need to install a monitoring package called “sysstat” using yum.
# yum install sysstat
Once ‘sysstat’ package is installed, start the service
# service sysstat start
3) IOSTAT:
The iostat command displays the average CPU usage since the last reboot. By default, the command without an option displays the average CPU usage and input/output stats of all the drives and their partitions. Execute
# iostat
To display the stats of CPU usage only, execute
# iostat -c
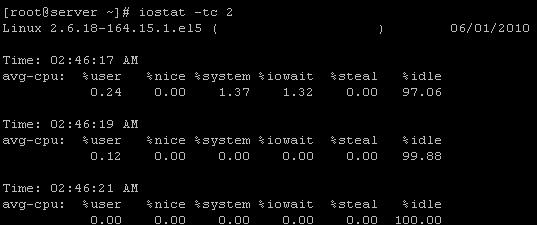
You may also want to display the CPU stats after every specific interval say, 2 seconds
# iostat -tc 2
4) MPSTAT:
mpstat command is use to display CPU usage of each CPU individually. By default, mpstat command without option shows the extended output of CPU usage. See below:
In order to display the usage of each CPU on the server, execute
# mpstat -p ALL
5) SAR :
sar command generates the stats for CPU usage, RAM usage and load average of the server and stores them in a file at regular interval. By default, the command without an option displays CPU stats of the current day.
# sar
One can also display the current CPU usage in specific time interval. The following command generates the output every 2 seconds for 3 times.
# sar -u 2 3
These are the ways to figure out the CPU usage on your system and then take appropriate steps to tackle CPU related issues.


